(2,1,1) convolutional code |solved problem |Trellis diagram
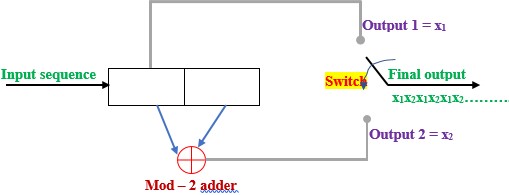
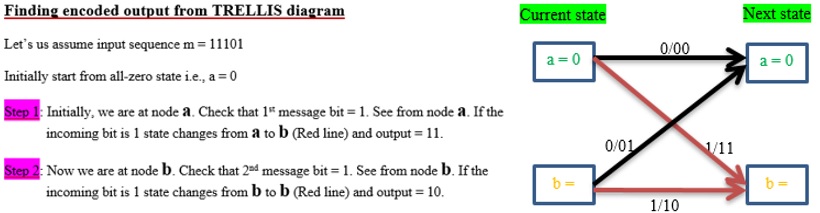
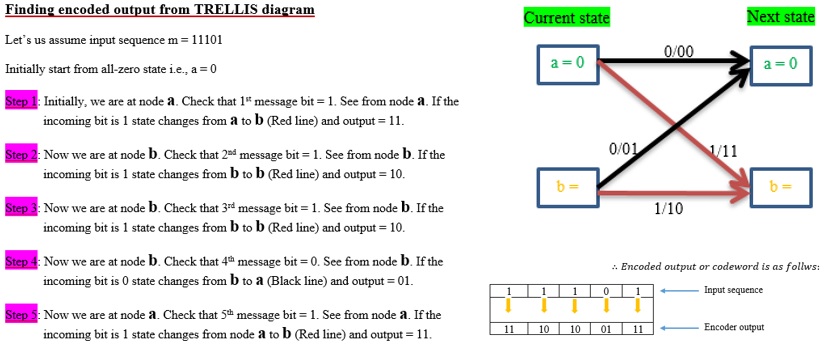
Q. Below figure depicts a rate ½, constraint length L = 1, convolutional encoder. Sketch the trellis diagram. Also find encoder output for input data: 11101
Step 1:
Step 2:

Step 3:
Step 4:
Step 5:
Graphical representation of Convolutional codes
3 different but related graphical representations can be used to study of convolutional encoding.
- Code tree = Tree diagram
- Code trellis = Trellis diagram
- State diagram
Note that we can easily find output of the encoder from any of the above diagrams.
Given a sequence of message bits and the initial state, you can use any of following 3 diagrams to find the resulting output bits.
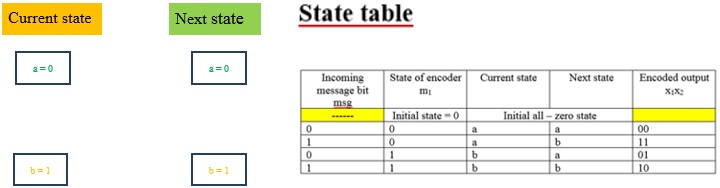
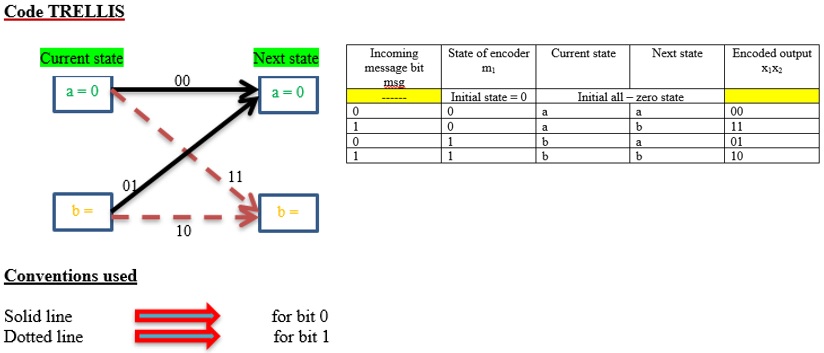
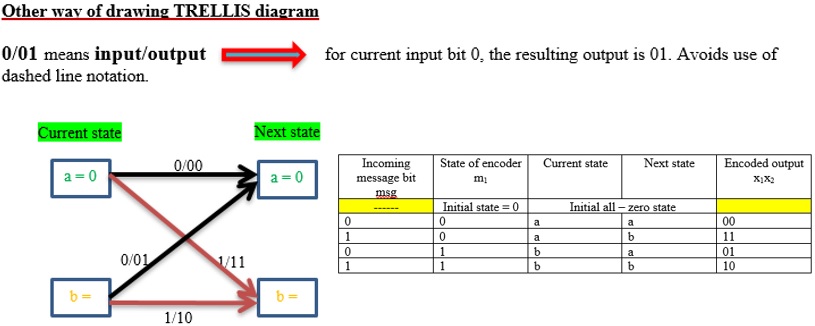
Trellis diagram
A more popular and compact method to describe convolutional codes is to specify their trellis diagram. It is so called since trellis is a tree like structure with emerging branches.
Convention used:
- A code branch produced by an input 0 is drawn as a solid line
- A code branch produced by an input 1 is drawn as a dashed line