Probability distributions | Probability Theory
A function describing possible values of a random variable X and their associated probabilities is known as probability distribution. Probability distribution describes set of possible values of a random variable and their probabilities. All random variables (discrete or continuous) have probability distribution. It is also sometimes called as probability function. So, a probability distribution may be continuous or discrete.
Note that discrete RVs give rise to discrete probability distributions and continuous RVs give rise to continuous probability distributions.
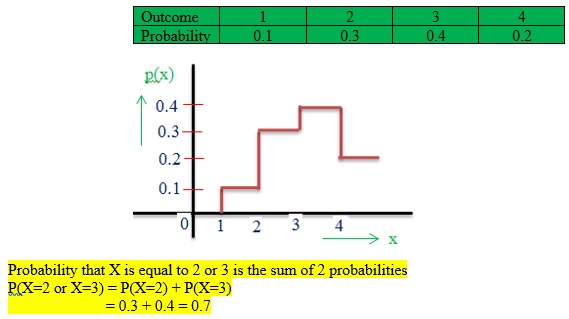
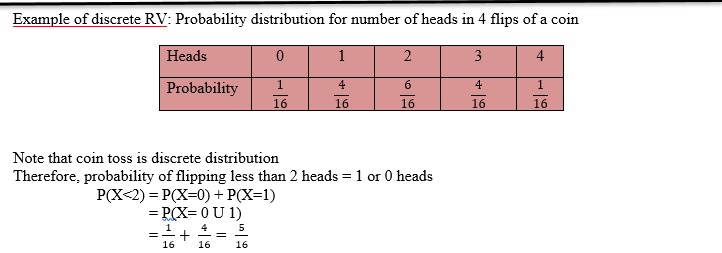
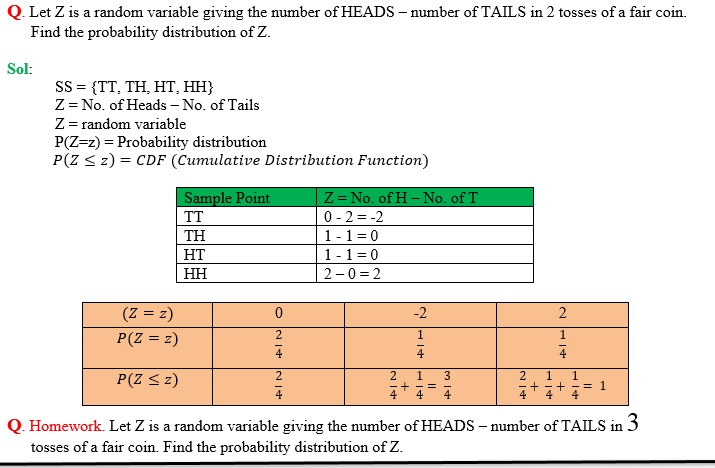
For a discrete RV, its probability distribution is a table, graph or formula that gives each possible value and the probability of that value.
Note that the total of all probabilities across the distribution must be 1 and each individual probability must be between 0 and 1.
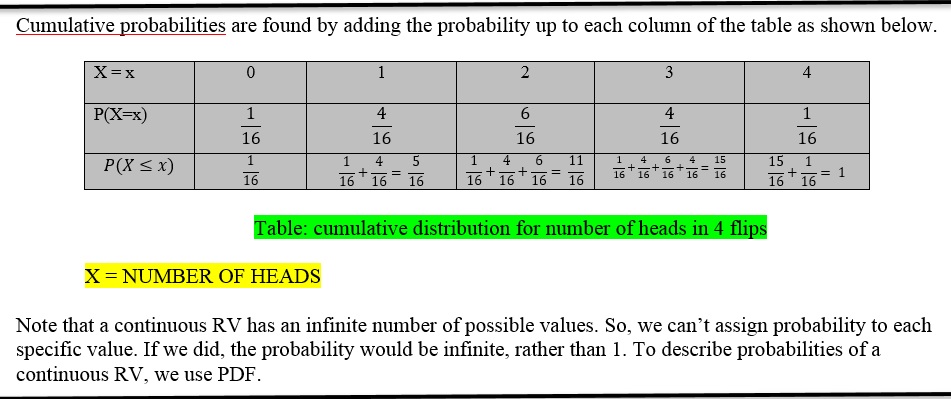
For discrete random variable, probability distribution can be either represented as a table or graph. For continuous random variable, probability distribution can’t be represented in a table, because of infinite values. Probability distribution of continuous random variable can be represented using graphs.

Example:
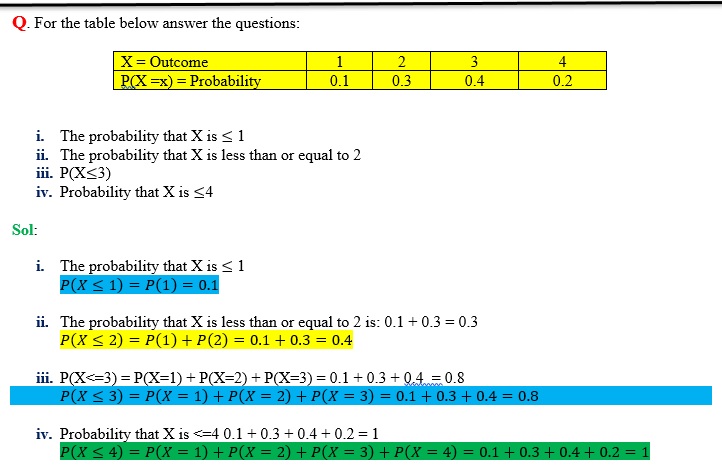
Suppose a variable X can take the values 1,2,3,4 and below table shows the probabilities associated with each outcome are:
